|
Activity Bar Graph -
Outcome D (10-30)-1
 |
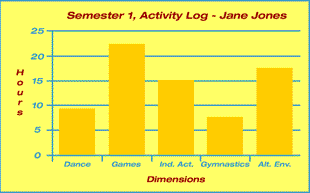
Sample Bar Graphs |
Students participate in numerous activities during
physical education class and outside of school. Have the students
keep a daily record of their participation in various types of physical
activity. This can be done in a logbook. Students will compile this
information to create a bar graph that compares their participation
in various activities for the month. Graphs could be made according
to the activity by logging the number of hours spent on each. The
activities could also be grouped into dimensions such as individual
activities, dance, types of gymnastics, games, and alternative environments.
A list of activites
can be accessed here.
Students will hand in a compiled completed bar
graph at the end of each month. The bar graphs will be handed back
to the students at the end of the specified time period so that
the results can be compared month to month.
Questions for the final comparison could include:
- Which month/weeks were
you the most active? Why?
- Which month/weeks were
you the least active? Why?
- How could activities
be scheduled into the month/weeks where you were less involved
in physical activity?
- After reviewing the
activities in relation to the physical education dimensions, which
dimension includes most of your activities? Why?
- Would a wider variety
of activities motivate you to be more active? Discuss your activity
choices.

Students can make a bar graph by activity only,
and not bother with what is done in any particular month.

Students can make a bar graph illustrating the
activities they participate in during the physical education course
to indicate what the course offered. To do a final comparison, students
could then compare the activities they did in physical education
class to those they do outside of class and discuss why the activities
may be different.

These are clues that you have reached the outcomes
...
Students have done a thorough job of making the bar graphs for
the specified period of time.
Students have indicated through the compilation
of results that they are committed to an active lifestyle and/or
understand how they could be more committed to an active lifestyle.
back
to top
|


